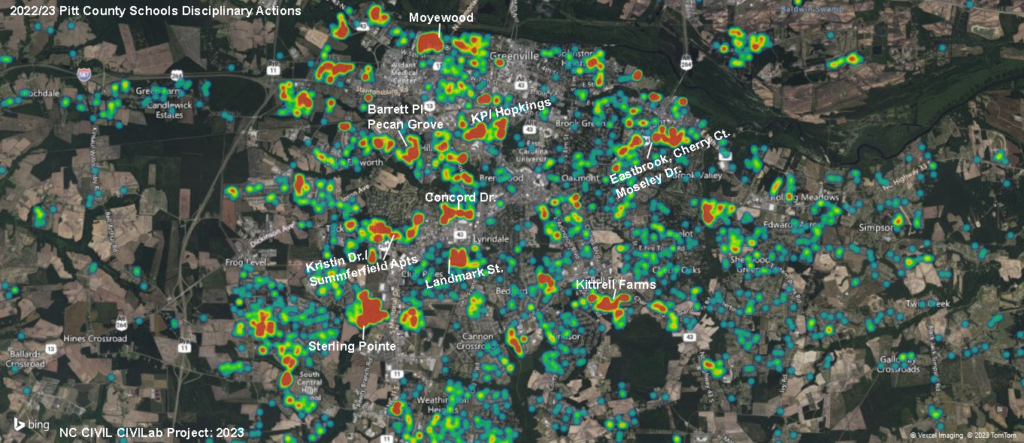
Pitt County Schools Disciplinary Actions Map
Research provided by NC CIVIL’S CIVILab Project in support of ONE Carolina’s Youth & Neighborhoods Impact Initiative (2023)
The image below reflects a report of all in-school disciplinary acts that have taken place in the previous 2022/23 school year for all schools in Pitt County. Occurrences will show as blue colored dots. As the number of incidents increase in an area, that location on the map will begin to show as “warmer”, indicated by a change in color from green, to yellow, orange, and then red – red indicating a “hot spot” where children are experiencing a higher amount of disciplinary actions in their school.
For anyone interpreting this data, it is important to note that an area glowing in red does not necessarily mean that the students there technically misbehave more than any other youth. There are several other factors that might make an area glow bright red. High density apartment communities tend to simply have more children living in a much smaller area. Lower income communities tend to simply have more people living within a small area, while higher income areas tend to have more single family living units spread much further apart, creating less population density. Also the severity of the behaviors prompting the in-school disciplinary act is also not detailed in this dataset.
What this data imagery can tell us is that those seeking solutions to the issues in our schools might find more effective outcomes by directing those efforts to these neighborhoods through more community-based approaches (rather than institutional efforts). Additionally, if other local disparities, including crime, unemployment, emergency room readmissions, etc. all begin to highlight these same communities, this would reveal for us that there’s a larger structural inequity present in the conditions impacting these neighborhoods, and the young people and families who live there.
***Privacy Disclaimer: To protect the privacy of our community members and the trust of our local partners, no personal identifiers (names of individuals) are used with any of our shared datasets. Just locations & GPS coordinates that are used to build the maps.
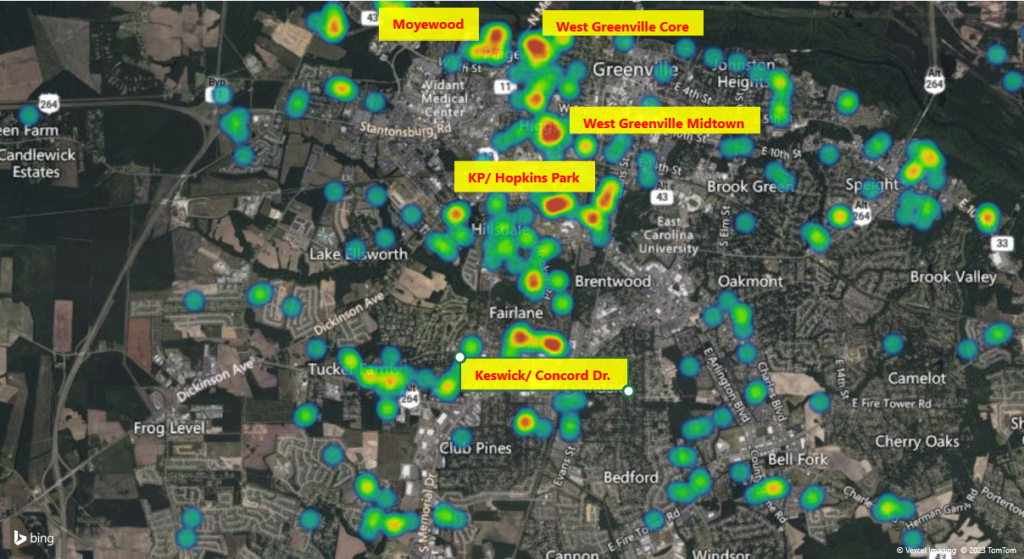
Greenville Police Department Crime Maps
Research provided by NC CIVIL’S CIVILab Project in support of ONE Carolina’s Youth & Neighborhoods Impact Initiative (2023)
This dataset represents all reported crimes related to drugs, weapons, violence, theft, and property from July 1st 2022 to June 30th 2023.
***Privacy Disclaimer: To protect the privacy of our community members and the trust of our local partners, no personal identifiers (names of individuals) are used with any of our shared datasets. Just locations & GPS coordinates that are used to build the maps.
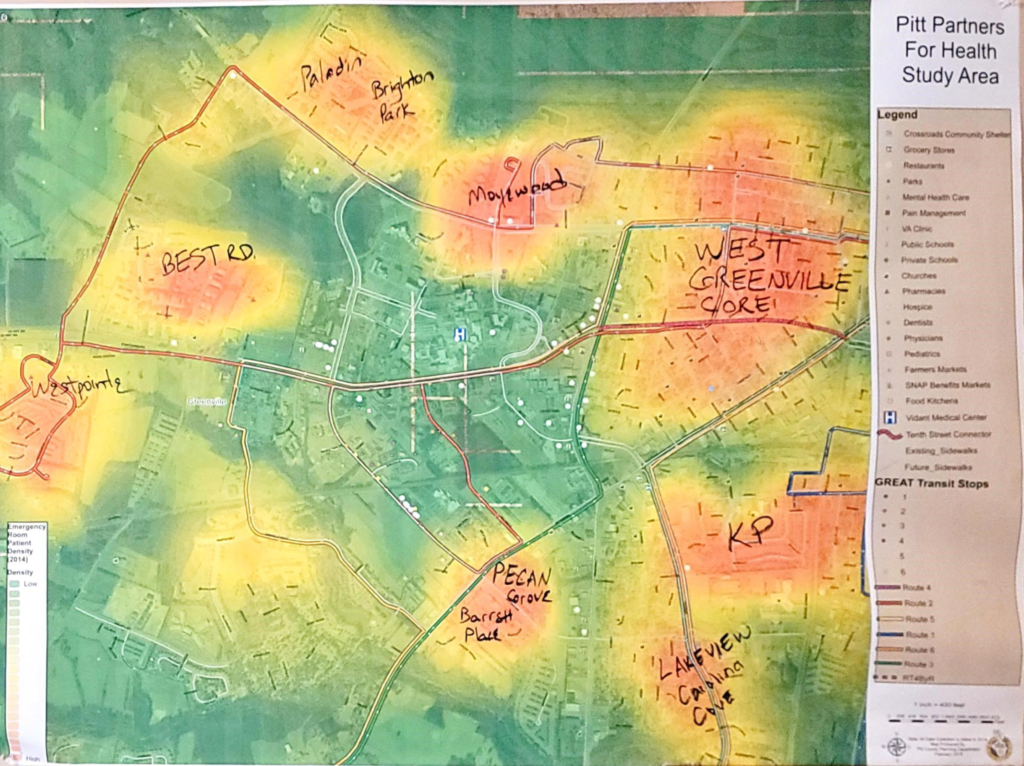
ECU Health Emergency Room Readmissions
Research Provided by Pitt Partners for Health (2016 dataset)
This dataset is from a 2016 study conducted by Pitt Partners for Health measuring emergency room readmission at ECU Health (formerly known as Vidant Health). An “Emergency Room Readmission” represents a case where an individual is admitted into the emergency room more than once for the same health condition that is either recurring or worsening. These cases are significant, because traditionally these kind of issues are best managed by a Primary Care Physician and may point to the presence of barriers to access to quality healthcare, which may be due to lack of health insurance, income, transportation, nonflexible jobs or other any host of issues that tend to be associated with poverty or other structural inequities.
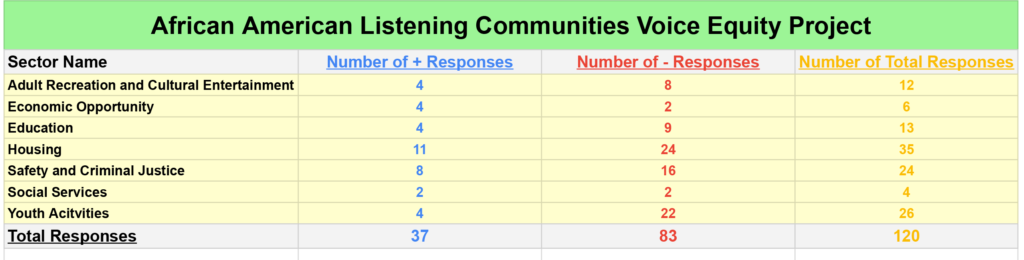
An Important Reflection from NC CIVIL’s 2022 African American Listening Communities Voice Equity Project
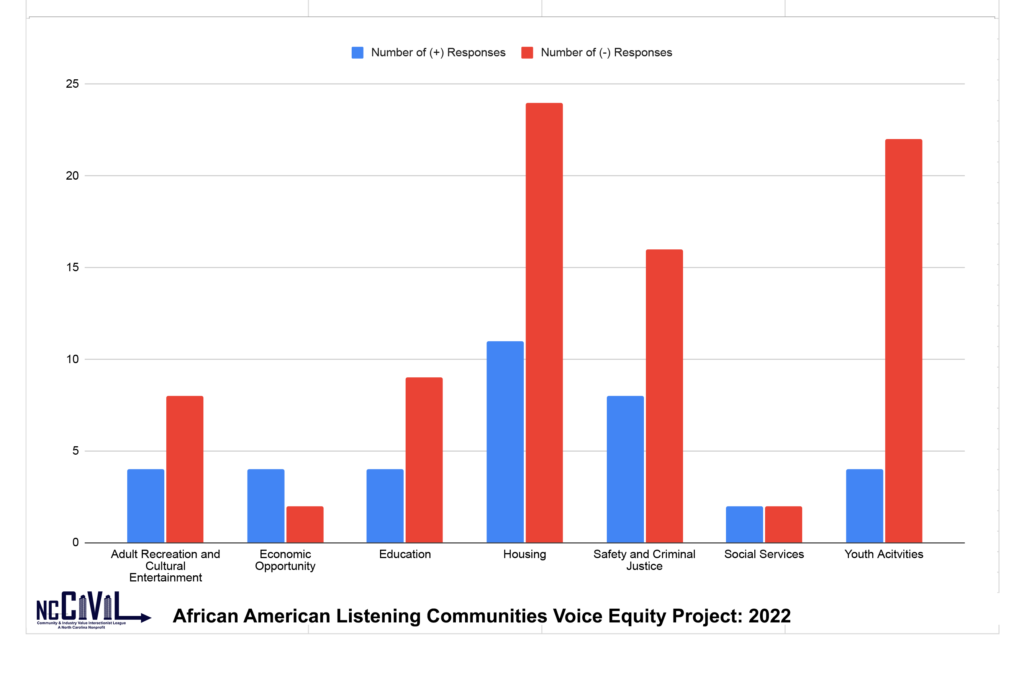
Over the course of 2021 & 2022, NC CIVIL conducted a survey of local African American neighborhoods in Greenville, NC after finding that many big datasets used to inform high level decision-making across the city, region, and state were not reporting on the conditions in these neighborhoods. The survey asked the opinions of residents in these communities about how well the services from local public serving institutions were performing in their communities. The goal was to take this captured data and share it with our local partner institutions to fill the data gaps and help them better see and understand the needs of these communities. What the survey uncovered, though, was something different and much more alarming.
While there were positive and negative responses, almost 3/4 of all responses were directed at only 3 public sectors – housing, youth recreation, and criminal justice, leaving Social Services, Public Services (incl. sanitation, transportation, code enforcement, etc.), Education, Economic Opportunity, Adult Recreation & Cultural Entertainment sectors with relatively little commentary. Our interpretation of this was not that the “big 3”, as we called it, were more important or performing better. Our interpretation was that the big 3 were super present in the every-day lived experience of these communities and the other 3 were not visibly present within that same community context.
We understood that Housing was a likely number 1, as that’s going to be an everyday struggle of renters having to constantly work with landlords and vice versa. It made sense that Youth Recreation & Activities would be a close second, as children in the neighborhood would again be something that residents would have to consider constantly. We questioned, though, why was it that Law Enforcement was the 3rd thing most present in the collective consciousness of these neighborhood residents, and, perhaps even more importantly, why were the other sectors not as present. Through much consideration of this, really wanting to give the most fair, accurate, and valuable interpretation we could, it occurred to us that Law Enforcement is the only one of the sectors that use their sector’s data to trace high occurrences of issues down to neighborhoods and then coordinate response at the neighborhood-level. considering this on a larger scale, if this is the same in other cities, it suggests that, as a national model of cities, the only system response we have to poverty is police. Additionally, while the way in which law enforcement has responded in these communities has been rightfully and loudly called into question over the past decade, we have yet to consider what a more balanced response from all public serving institutions might look like. If instead of only police showing up in these neighborhoods to respond to the safety & criminal justice need, education, youth recreation, economic empowerment, social services, housing, and healthcare all showed up with neighborhood level response. And what if we all showed up with collaborative and follow the lead of community members and community-based organizations, guided by structured community-based empowerment approaches?
We began sharing this with local sector partners in Greenville and Pitt County and they listened with interested ears and a desire to explore alternatives. Thanks to our partners at East Carolina University’s Water Resources Center and their National Science Foundation Grant funded CoPe Project calling for resident empowerment through community science, we are able to begin this process of coming together now. Won’t you join us.